 Business Queries: +919663372351 | Career Queries: 080-49253909
|
Call us now : Business Queries: +919663372351 | Career Queries: 080-49253909 |
Blog | Careers | News | Sitemap | Contact Us

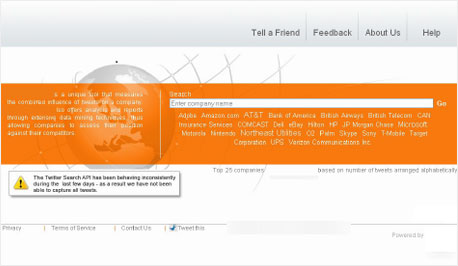
Neev designed and developed a web application that lets the client’s customers monitor tweets and generate valuable insights. Neev also supports and maintains the system. The application helps businesses know their influence on Twitter and enables them to react to positive/negative tweets quickly. This application is helpful in identifying customer dissatisfaction, consumer perception of a product, for brand management and in various other ways.
The Twitter research and strategy application offers customers a view of trends. It uses advanced mathematical models, extensive text mining, sentiment analysis and data analysis to provide actionable insights and solutions. The application lets the client’s customers organize relevant tweets based on geography, experience, competition, author, keywords, number of tweets, etc. Over 300 of the Fortune 500 companies have signed up for this service.
The client is the first BPO Company to provide Integrated Customer Lifecycle Management services (CLM) across the financial services, technology, telecommunications and retail industries through a multi-shore global delivery model. With state-of-the art facilities across 10 global delivery centers that accommodate nearly 8,000 seats, the client is among the top 20 Contact Centers worldwide. It has 10 global delivery centers that process over 8 million transactions per month.
With the rise of social media and particularly, Twitter, businesses are increasingly focusing on their brand image and influence on Twitter and on customer opinions expressed in this space and more importantly, to assess competition through Twitter. On the request of many of its customers, the client wanted to create a tool to enable businesses to know how they were being affected through discussions on Twitter. A lot of information is generated and stored on Twitter. The client required a tool that would categorize this information on the basis of geography, keywords, etc and generate actionable insights by mining this data.
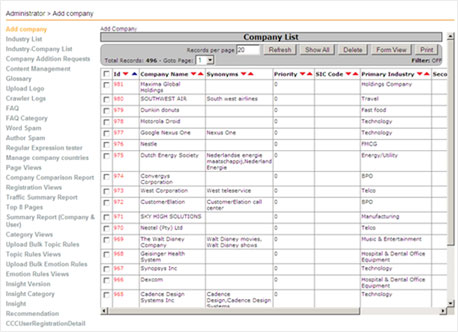
With its expertise in J2EE, Neev designed and developed a system that stores and processes huge amount of current and new incoming data. The tool measures the influence of tweets on any organization. Using the crawler implemented by Neev, the system performs a crawl of tweets, stores the tweets assigned to a particular company and classifies them according to the information displayed on the system. If a company is not present in the system’s database, a form where the user can submit a request for its addition to the database is displayed.
The system automatically identifies location details from a Twitter user profile and assigns a region and country to the author and the tweet accordingly. As per pre-defined rules, the system identifies emotions of the tweet and also classifies the data. The system uses various data classifiers like author classifier, spam filter, location filter, emotion classifier, keyword classifier and topic classifier. Terracotta has been implemented to facilitate a Master Worker format that processes tweets on a queue format.
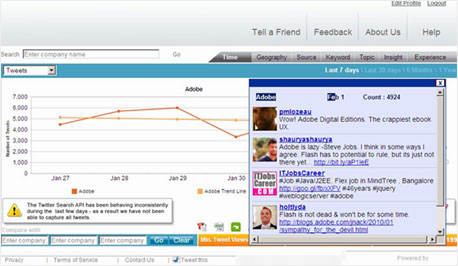
The system analyses tweets and categorizes them as either positive or negative based on keywords, number of tweets at any time, topics, experience and the geographical origin of these tweets. The application also provides analysis and insights through categorizations like tweets by author, tweets by geography and tweets by competition. In-depth analysis and reports can be generated for any brand/product/organization being tweeted about. Regular expressions are created automatically based on rules uploaded. These expressions are used to build the emotion and topic classifier process.
Different tabs were designed and each categorization was assigned a tab. A stats generator was built to generate the statistical data that is displayed on different tabs. Google Chart API (Application programming interface) and Visualization API are used to show the data as:
Export options are provided to export the graphs or data as PDF or CSV file. The system runs on AWS cloud. A server-database integration model has been setup with a master-slave backup.