 Business Queries: +919663372351 | Career Queries: 080-49253909
|
Call us now : Business Queries: +919663372351 | Career Queries: 080-49253909 |
Blog | Careers | News | Sitemap | Contact Us

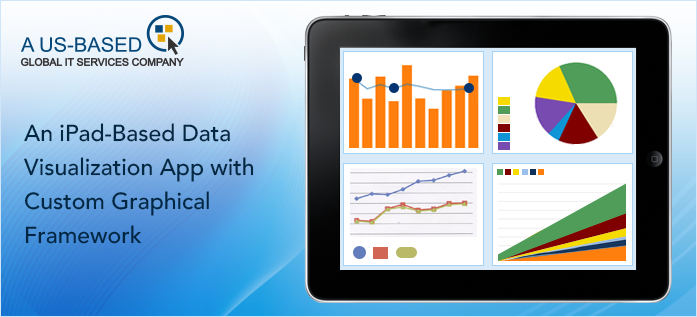
Neev developed an app to visualize data logged from calls handled by the client on behalf of their customers. This would then be sent to customers’ management team to improve their decision making process. Neev handled the UI/UX Design, Development and Testing of the App.
The client is a giant in the BPO industry providing ITeS (IT Enabled Services). To achieve this, it integrates different channels of communication, such as web chat and mobile interactive voice response (IVR). Their customers include large telecom, financial services, retail, technology and travel companies.
The client had to handle a large volume of calls on a daily basis, many of which were not being analyzed accurately. The management teams of many of their customers wanted more details about the calls being handled. They wanted to know about the geographical distribution of the callers, demographics and the specific enquiries made during the call. Making this information available to the management would enable them to take informed decisions. The data, which was previously available only after one month was required to be made available on a daily basis. To ensure security of customer data, each customer is to receive only the data which is specific to the process outsourced by them. The App had to be lightweight and designed for iOS, providing for easy and visually pleasing access on the iPad
An easily understandable overview of the data logged during the calls is provided. Most of the data is represented graphically. The representation is not only simple but also detailed. For instance, if the software is to represent the geographical distribution of the callers it would even classify the areas as urban/rural etc.
It was also initially suggested that graphical frameworks like FusionCharts or a simple Excel Sheet be used to draw the graph. But, it was not providing the kind of drill-down that was expected, was not visually appealing and would not work on the iPad. So Neev built the entire graphical framework from the ground up, using JavaScript.
The application pulls the call data and sends it to the Application Server to translate it into graphs. A custom built framework developed by Neev ensured that the data logged during the calls was sorted properly.
The technology architecture was handled by the client. The development, database integration, UI/UX design and testing was done by Neev, but the deployment was done by the client.
As the solution is meant for the iPad, the iOS SDK framework (based on C and C++) was used for the development and design. Java was used to back up images.