
|
Call us now :  Business Queries: +919663372351 | Career Queries: 080-49253909 Business Queries: +919663372351 | Career Queries: 080-49253909 |
Blog | Careers | News | Sitemap | Contact Us

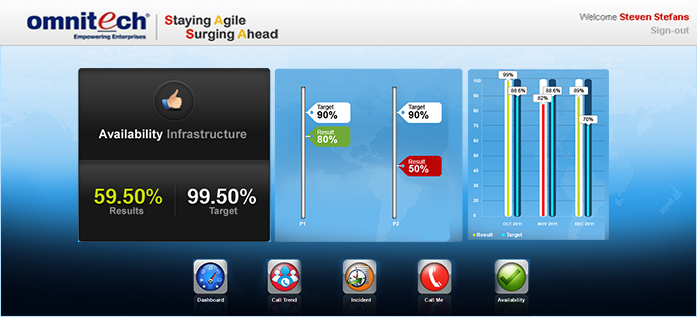
Neev created a data visualization application for infrastructure monitoring for use on iPads. This tool was created for CIOs of client’s customers who avail the client’s IT infrastructure services. The application gives such busy executives a summary view of the performance metrics of their IT infrastructure in the form of infographics. This not only saves time for the CIOs but also helps the client serve its customers better.
Omnitech InfoSolutions Ltd, a global IT services company is primarily involved in strategic IT outsourcing and managed services. Omnitech InfoSolutions started in 1987 and has emerged as India’s first IT managed services provider. Omnitech delivers value to its enterprise clients as their Technology Transformation Partner. To its credit, Omnitech has internationally acclaimed Quality Certifications like ISO 9001:2008, ISO 20000, ISO 27001 & 27002 and BS 25999. It has a presence in Europe, US, Australia and Asia.
Omnitech provides IT infrastructure services to businesses all over the globe. The Chief Information Officers (CIOs) of these customers were not fully aware of performance of their IT infrastructure , as managed by Omnitech. Owing to their busy schedule, they did not find time to go through, analyse and derive insights out of performance data previously made available through excel sheets. In order to provide greater clarity and transparency, Omnitech wanted to develop an application that would enable the CIOs of its customers to have a quick, overall view of the performance of IT infrastructure managed by Omnitech, on-the-go. The application was required to load fast, be user-friendly and work like a native application.
Neev ideated, conceptualized, designed and developed a data visualization application for iPads for use by CIOs of Omnitech’s customers. An evaluation of the various choices of platforms, technologies and frameworks available was carried out. Non-Functional Requirements like support for gestures, user friendliness of the application, faster loading speed were considered and planned from the design stage. The application was developed by understanding the various metrics and parameters to evaluate performance of IT infrastructure services and creating a data visualization model of the same. The application summarizes various performance metrics data offered by Omnitech and displays them in the form of infographics. Custom widgets were created to build the infographics and represent graphical data based on the metrics available. The application was available only to the customers of Omnitech. Omnitech provides this application to all its customers to enable them to stay up-to-date on the performance of all IT infrastructure services from Omnitech.